
Do you know anything about SCOM?
System Center Operations Manager has a lot of different features, but what is System Center Operations Manager and how does it work? Well, System Center Operations Manager is a component of the System Center suite, and in our case we’re using the 2016 version. It enables us to monitor services, devices, and operations for many computers and many different types of computing devices in a single console. We can gain quick insight into the state of our environment, and our IT services running across different systems and workloads by using numerous views that show the state, health, and performance information.
It also generates alerts and shows us performance configuration, and security issues. One of the main tools in Operations Manager is our management center computer, and on that particular computer or server, we have a management interface, and it does a lot of different things. One of the things it does is it checks for problems in a management group. In many Operations Manager setups you’re going to see many different management servers, and if there’s any kind of a problem in that management group, then we can find out using that management interface.
We can also start monitoring a computer. This is at the heart of Operations Manager, is monitoring, and we can start monitoring a computer after we push the agent out to our Windows computer, and there are also agentless devices that we can send out to as well. We can create or modify a resource pool. Resource pools are something that we’re going to demonstrate in upcoming videos. We can create a group and give certain rights to those groups, and we can edit those groups as well.
There are lots of predefined security definitions for groups, but we can customize those settings if we desire. We can create or customize a view. There’s lots of different types of views, and some may or may not apply to you, which is why you have the option to do so. There’s event views, there’s state views, performance views, task status views. All different types of views that you can add or delete from your view list.
You can also check the heartbeat status between your management server, other management servers, and your devices. You can also change how often your management server reaches out to other servers and devices to check the heartbeat to make sure the device is up and running. The heartbeat is done using TCP/IP, and a simple ping type request to make sure that the other devices are running and still communicating with our management server. One of the main functions is going to be the rules, monitors, and alerts.
These particular functions give us the main information that we’re looking for when we are monitoring a device. The rules are setup to basically tell us what our thresholds are before we’re going to trigger an alert, and the monitors actually show a graphical representation if those devices have reached those thresholds. We can also use Operations Manager to give users permissions so they can look and see how their device is performing.
In some cases, you may not want this to happen, but in other cases you may have users who require this information to make sure that their device is operating optimally for the job function that they are providing the company. We can also use the tool to investigate a gray agent. A gray agent is an agent that is no longer communicating between the device and the management server, and using the investigation part of the Operations Manager, we can take a look and see why it is no longer communicating.
It could be that the device is offline, or there is a TCP/IP problem, or there is some other issue with the device. Knowing how to utilize Operations Manager can help the IT administrator decide how to best utilize System Center Operations Manager in their network environment.

Feature of SCOM is:
- Connection Health
- Vlan health
- HSRP group health
- Port/interface
- Processor
- Memory
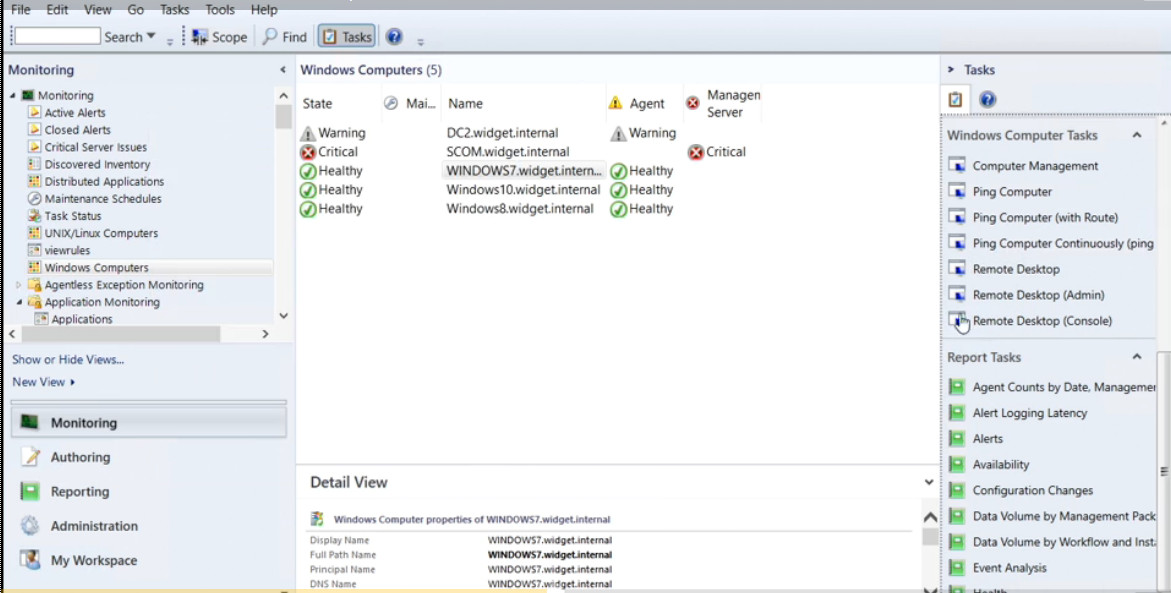
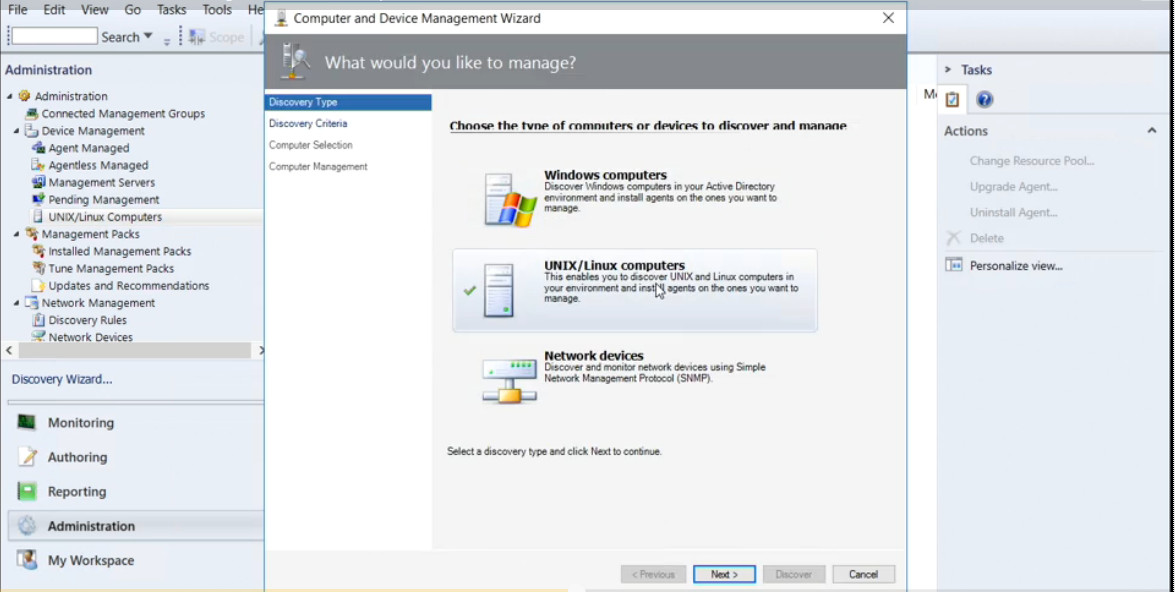
Some pictures of Environment:
Source: Lynda.com


