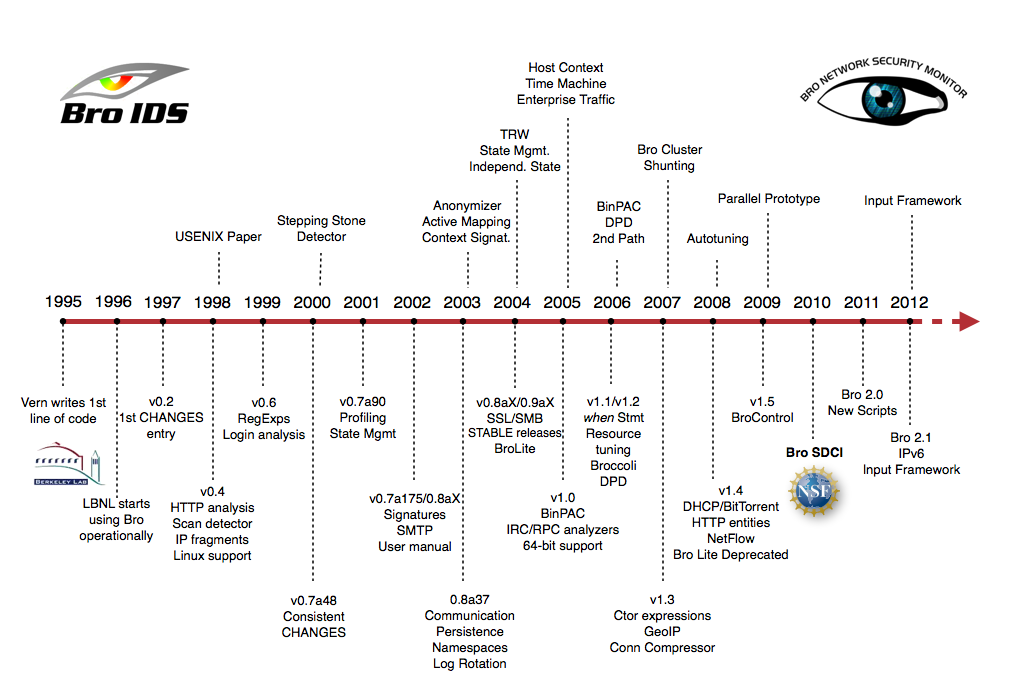
Much of Bro’s capabilities originate in academic research projects, with results often published at top-tier conferences. Bro supports a wide range of analyses through its scripting language. Yet even without further customization it comes with a powerful set of features.
-
Feature
- Runs on commodity hardware on standard UNIX-style systems (including Linux, FreeBSD, and MacOS).
- Fully passive traffic analysis off a network tap or monitoring port.
- Standard libpcap interface for capturing packets.
- Real-time and offline analysis.
- Cluster-support for large-scale deployments.
- Unified management framework for operating both standalone and cluster setups.
- Open-source under a BSD license.
- Support for many application-layer protocols (including DNS, FTP, HTTP, IRC, SMTP, SSH, SSL).
- Default output to well-structured ASCII logs.
- Real-time integration of external input into analyses. Live database input in preparation.
- External C library for exchanging Bro events with external programs. Comes with Perl, Python, and Ruby bindings.
To install on Debian:
1- sudo apt-get install cmake make gcc g++ flex bison libpcap-dev libssl-dev python-dev swig zlib1g-dev
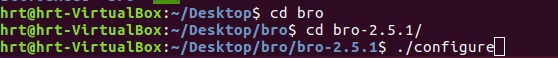
2- download from https://www.bro.org/download/index.html and extract it in VM machine.OR git clone –recursive git://git.bro.org/bro
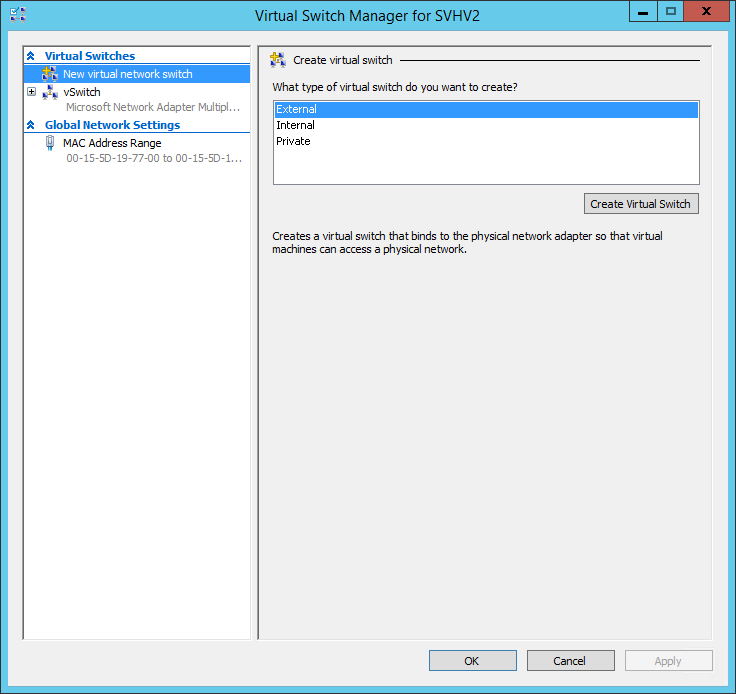
3- just like picture configure it
./configure
4- Then type : make
5- Then type : sudo make install
6- Copy path to Bro install folder :
nano ~/.bashrc
add this line in the end of file
export PATH=/usr/local/bro/bin:$PATH7-Config your node interface .
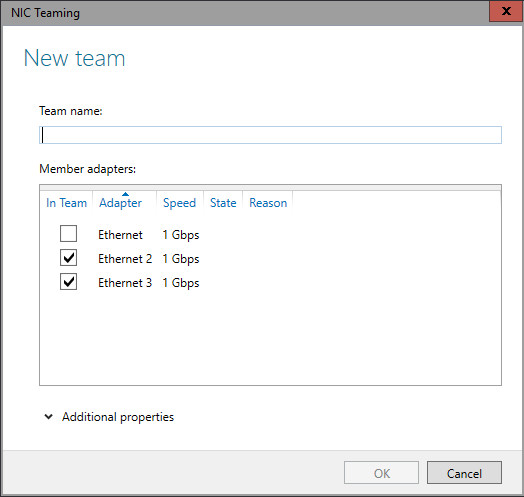
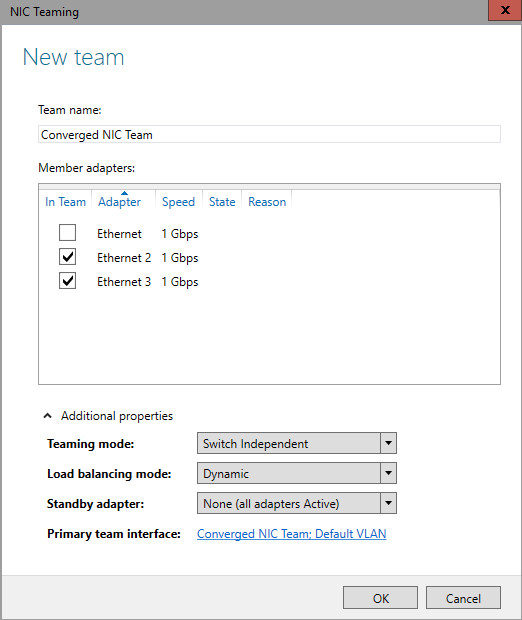
sudo nano /usr/local/bro/etc/node.cfg[bro] type=standalone host=localhost interface=eth0*Note: You can define two or more network here. The name [bro] can be change for yourself as an option.
8-Now change the directory and go to Desktop and make your user super user with sudo -s . Then type broctl
9- in [BrotControl] start for starting bro | stop for stopping bro | nodes show number of nodes | status shows the name of node and bro
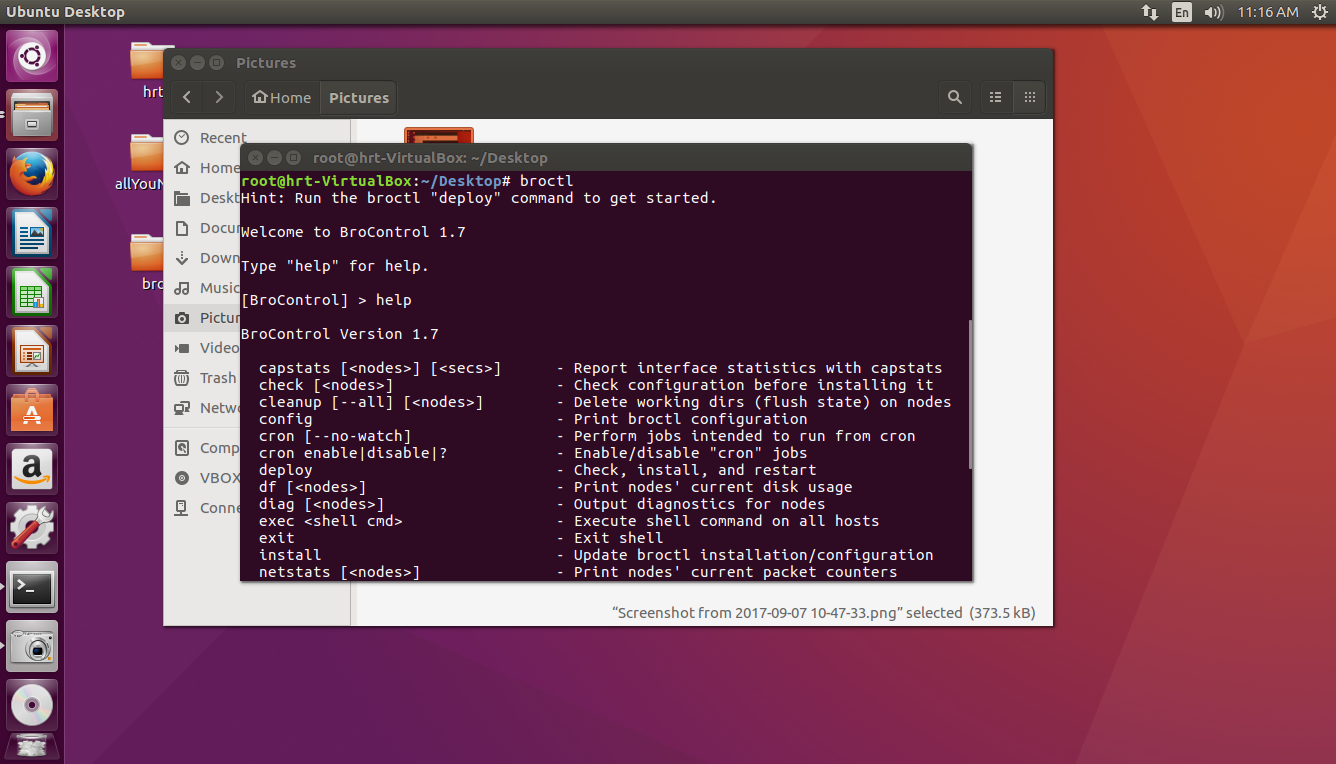
* for Starting service always in [BroControl] first install then type start
- if you get an error, you should define your network adapter in this file:
nano /usr/local/bro/etc/networks.cfg - These are other files for your configuration:
nano /usr/local/bro/etc/networks.cfg
nano /usr/local/bro/etc/node.cfg
Go to this link for more information:
https://www.bro.org/sphinx/components/broctl/README.html
Log files by default is located in this path:
/usr/local/bro/logs/
with zcat command you can read logs but there are also some techniques you can boost your report. follow this link:
useful links for installing on server:
https://www.digitalocean.com/community/tutorials/how-to-install-bro-on-ubuntu-16-04